- Home
- Fundamentals of Email Marketing
- What Is A/B Testing in Marketi ...

✨ Key takeaways:
⭐ A/B testing is used when you need to compare two versions of an email, ad, or webpage to determine which performs better.
⭐ A/B testing is crucial if you want to improve conversions, email content, and user experience and to make informed, data-driven decisions.
⭐ To make sure that A/B test results are reliable and not due to chance, they need to be statistically significant.
⭐ Common mistakes with A/B testing include running tests on too-small samples, misinterpreting data, and ignoring external influences.
Did you know that companies using A/B testing for their marketing strategies can boost conversion rates by hundreds of percent? They can also make their email and landing page content more appealing to consumers. A/B testing is also crucial in improving UX. And these are just some facts that demonstrate the importance of this marketing tool.
This information highlights the transformative potential of A/B testing in optimizing marketing strategies. However, understanding the role of statistical significance is crucial to fully harness this power.
What Is A/B Testing in Marketing?
A/B definition and purpose
We sometimes flip a coin if it is hard to choose between two options. Simply speaking, A/B testing is the coin. It helps to understand consumer’s perceptions of your online products and features.
Scientifically, A/B testing is a method where two versions of a marketing asset, like an email, advertisement, design layout, or webpage, are compared to determine which one performs better. It is also known as split testing. The typical use of A/B testing is to optimize email marketing campaigns, increase conversions, and improve UX by taking statistically justified actions.
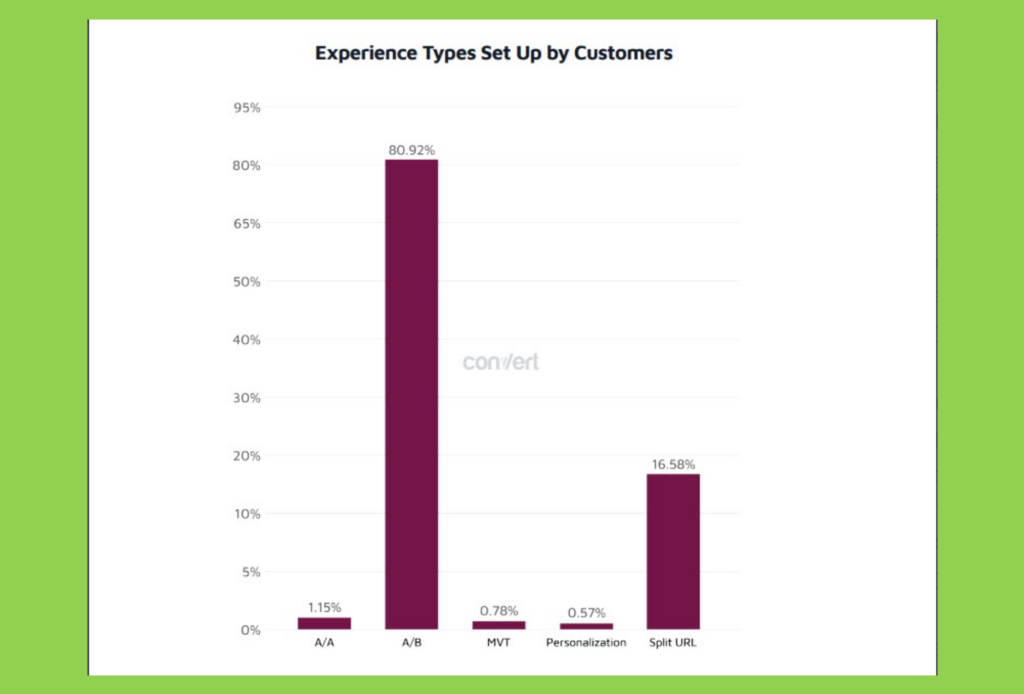
This type of testing has become extremely popular among marketers all over the world. According to Convert, a U.S. digital marketing research company, almost 81% of its users have chosen A/B testing as their prime marketing tool.
A/B testing originated in the early 1900s and was first used in agriculture and medical tests. For decades, it was a niche tool limited to those areas. However, since the emergence of the digital age, the method has gained popularity in online marketing.
The Internet made it possible to conduct A/B tests quickly and efficiently. Digital giants like Google and Amazon were among the trailblazers in the 2000s if we talk about the brightest A/B testing examples on the corporate level. They started to actively use A/B testing to fine-tune user experiences and increase conversion. Now, A/B testing is a standard digital marketing procedure that many businesses use every day.
Let’s check out several important facts that underline the importance of A/B testing. According to 99Firms, an international marketing agency:
🔹 Around 75% of companies around the world are running A/B testing on their websites.
🔹 Six out of ten companies use email A/B testing.
🔹 Because of A/B testing, a better UX design can increase conversions by up to 400%.
Process overview
As a marketing tool, the A/B testing process consists of several consecutive steps. Let’s check out how to implement A/B testing:
- Hypothesis. The process starts with formulating a hypothesis based on the test’s purpose. This can be improving the product or learning information.
- Variable selection. It is time to choose the specific element to test, such as an advertisement, a call-to-action device, or an email.
- Audience segmentation. The audience is at the heart of the A/B testing process. You should divide the audience into two groups. The first one is the control group (A), and the second one is the test group (B).
- Analysis. First, we collect data on how each testing version performs. Then, we analyze the outcome to determine the winner out of the A/B paradigm.
A/B Testing Statistical Significance
Statistical significance in A/B testing is one of the key elements. It measures if the observed differences between A and B variations are due to the changes made or just by chance. Statistical significance ensures that the test’s outcome is reliable for business purposes. This knowledge provides a safe ground for making further confident and scientifically-proved decisions in the marketing sphere.
Importance of A/B test statistical significance
The absence of statistical significance can lead to risky or non-comprehensive decisions based on random assumptions rather than scientifically proven improvements. Such an approach may result in the wrong marketing strategies and a potential lack of optimization. Choosing a worse-performing asset instead of a better one can lead to significant marketing failures and financial losses.
Basic terms in A/B testing analytics
It is essential to come to terms regarding A/B testing statistical significance. Let’s learn the most important terms in A/B testing with their brief descriptions.
- P-value: It stands for probability value, and its number describes how likely your data would have occurred under the null hypothesis of your statistical test. A lower p-value, usually less than 0.05, suggests strong evidence against the null hypothesis. Thus, the lower the p-value, the greater the statistical significance of the observed difference.
- Null hypothesis: A statistical hypothesis that proposes that no statistical significance exists in a set of given observations. It is used to assess the credibility of a hypothesis by using sample data.
- Confidence level: It represents the probability that the results are not randomly generated and can be used for reliable business decisions. The confidence level common numbers are from 95 to 99%. For instance, a 96% confidence level means there is only a 4% probability that the results occurred randomly. Such a number implies confidence in the test result.
- Sample size: The number of observations or participants in the A/B test. Of course, a larger sample size increases the reliability of the test outcome and helps ensure that the results are statistically significant. On the other hand, small sample sizes lead to unreliable results and mistaken conclusions.
- Variance: It measures the spread of data points. Variance impacts the reliability of the A/B test’s results. High variance indicates a wide scope of responses, making it harder to detect a true effect. Conversely, low variance means that the data points are more consistent, which helps to achieve statistical significance.
Determining statistical significance
Statistical significance has several key criteria which determine it. Let’s check them out:
Calculating the p-value: The p-value is the variable that determines if the test outcome has statistical significance. A p-value less than 0.05 indicates that the results are not due to chance. This provides confidence in the effectiveness of the variation. For instance, in A/B testing of two investment portfolios, A and B, whose performance differs from the S&P 500 Index with p-values of 0.10 and 0.01, respectively, the investor should feel safer with portfolio B. The portfolio will demonstrate consistently different results thanks to a lower p-value of 0.01.
Confidence levels: As a rule, common confidence levels vary between 95 and 99%. A 97% confidence level means there’s a 97% probability that the outcome is not due to random variation. As you can see, higher confidence levels give more assurance; however, they also require larger sample sizes. As shown in the case study by Act On digital marketing agency, a confidence level of 95% or above is a must for email split testing. The task was to show why testing two variations of email creative that generate a higher clickthrough rate needs a sufficient confidence level. The analysis shows why confidence level matters and how to avoid statistical errors while conducting split testing.
Sample size and power: A sufficient sample size is crucial for reliable results. Statistical power is the probability that the A/B test will deliver a correct result. Higher statistical power reduces the risk of so-called Type II errors, which means failing to detect a real difference. Yaniv Navot, Dynamic Yield’s CMO, believes that the sample size for statistically significant email A/B testing must be at least 50,000.
Practical Steps to Ensure Statistical Significance
Let’s learn, step-by-step, what actions a marketing researcher must take to achieve statistical significance for an A/B test. MailerLite, a digital marketing company, has been conducting A/B testing over the years. For example, they tested the length of subject lines in their emails.
Step 1: Designing the A/B test
Formulating the task is the first step in designing an A/B test. The main principle of an A/B test is to choose the right variable and correctly split participants into two equal-sized groups. Here are the two phases to achieve it:
- Choose the variables that will impact the key metrics: two different versions of a piece of content like email or design layout must be created, with changes to a single variable. In the case of MailerLite, the company was split testing different lengths of subject lines.
- Define control (A) and variation (B) groups in similar sizes to ensure comparability.
Step 2: Running the A/B test
This stage is about actually running the test, and it also has two parts:
- First, random assignment of participants is necessary to minimize bias.
- Introduce the existing product or feature to the control group and the new product or feature to the test group. You must also ensure the correct test timing to obtain sufficient data.
Step 3: Analyzing the outcome
The final step is all about interpreting the data received based on statistical significance. It is divided into two parts again:
- Use statistical tools to calculate p-values and confidence levels.
- Considering the test context and external factors, the outcome must be interpreted comprehensively.
So as the split testing results returned, MailerLite came to the conclusion that concise subject lines worked better. The split testing showed that shorter subject lines in emails could achieve a 100% open rate and an 85.71% click rate.
Avoiding Common Pitfalls
Like any other complicated statistical procedure, A/B testing has its nuances and potential hazards. Let’s learn the most common pitfalls and how to deal with them.
Problem 1: Insufficient sample sizes
Solution: You must refrain from concluding A/B tests with insufficient data sourced from small sample sizes. Such an approach can lead to accurate outcomes and marketing decisions. The audiences must be similarly sized.
Problem 2: Multiple testing
Solution: Launching multiple tests simultaneously increases the risk of false-positive results. First, you can fix it by adjusting significance levels. You can also choose from applicable statistical techniques, such as the Bonferroni correction.
Problem 3: Out-of-context testing
Solution: You must always consider external factors that might influence the outcome. For example, taking into account seasonal trends can be helpful. Also, plenty of market changes like consumer behaviour fluctuations can play a role here, so you must watch them.
To learn more about A/B testing:
Subject Line A/B Testing Techniques and Examples in Email Marketing
Call-to-Action in Email: A/B Testing Tips for More Leads and Sales
A/B Testing Software in Email Marketing
To Sum Up
Making informed decisions and dealing with the power of stats is crucial in today’s marketing. A/B testing is a very efficient way to improve your online product performance. A/B testing is a powerful tool for optimizing digital marketing strategies, including improving conversions, developing better email content, designing more appealing UX, and so on.
Its true potential is expressed through understanding and implementing A/B testing statistics, especially statistical significance. The key is ensuring that A/B tests are statistically significant. This way, you can make statistically reliable, data-driven decisions that lead to taking your marketing strategy to the next level.